It’s official. Durban ranks
among the most expensive
ports in the world.
That’s according to
the latest ‘must-read’ for
everybody in the shipping
and freight industries – the
Port Regulator’s “Port
Benchmarking and Indicators
Research”.
It’s the most magnificent
compilation of port
comparative statistics you’re
likely to come across – and in
SA terms it’s a definite gold
medal winner.
It is an in-depth study of
all the Transnet National
Ports Authority (TNPA) costs
at the SA port network and
certain individual ports, Port
Regulator CEO Riad Khan
told FTW.
If you want to know how
much a container vessel had
to pay in total maritime and
infrastructure costs on April
1 per ship call (excluding
harbour dues), you’ll find that
Durban (at US$27 933.50)
comes in well behind
Rotterdam (at US$40 176.97).
But, including cargo dues,
Durban steams out into
the front for total cost (at
US$182 151.30). Although
that’s closely followed by
Long Beach, Los Angeles
and Port Klang costs, it’s still
over twice the US$86 251.58
average for the 12 ports
and a massive 879% above
the lowest costing of the 12
(Kaohsiung).
Put together internally,
Khan said the report answers
almost all of those niggling
questions you’ve ever had
about the ports.
It’s divided into three
parts:
Part A is: “A TNPA tariff
comparison with selected
ports for a unitary bulk
vessel that is exporting coal
out of each port.” (This uses
the Port of Richards Bay
compared to 10 other major
ports around the globe).
Part B: “A TNPA tariff
comparison with selected
ports for a unitary container
vessel calling at each port.”
(This uses Durban compared
to a total selection of 11
other major ports around the
world).
And Part C: “Port
comparators for selected
international ports and TNPA
national and individual port
indicators over time.”
Another distinct plus
mark for the research is that
– although some figures,
like global port rankings –
use 2008 figures, the vital
figurework, like the tariffs
and costs, are all in April 1,
2010 terms. As up-to-date as
you could expect.
And it’s not necessarily
written in stone, because this has been released publicly for
everyone to read and absorb
– and question if need be,
according to Khan.
“This series of research on
port benchmarking and port
performance is published
for comment, criticism and
relevance testing,” he told
FTW.
“The research is intended
to commence the process of
long-term key performance
indicators (KPI) monitoring
and to provide information
that assists stakeholders
to better engage with the
Regulator in its various
programmes.”
Khan invited FTW readers
to look at the research and
submit any comments they
have by December 15. Not
that the issue is even then
finally signed, sealed and
delivered. “Comments
beyond this period would
also be appreciated,” he
added.
If you are questioning
the relevance of particular
indicators and comparisons,
you are welcome to indicate
why they are not relevant
and which indicators should
be used to replace them that
better serve the information
or monitoring needs of such
stakeholders.
Any doubts about the ports
selected as comparators can
also be expressed. If you
feel that any of the ports
are not appropriate, suggest
those which should have
been used instead. Also why
your preferred ports should
be used in the future. (Just
remember that the ports
chosen have all released
their latest stats publicly –
and many of the other ports
are either very sluggish in
releasing their figures, or
keep them totally secret.)
To view this analysis go
into web-site: http://www.
portsregulator.org/
When the home page is
downloaded, click on “Latest
News” in the top right. Then
click on “Port Benchmarks
and Indicators Research” –
and you’re in.
Here are answers to a
few of the frequently raised
questions.
How fast do the gantry
cranes work? In Durban
2008, they managed 23 crane
moves per hour. Antwerp
managed 94 per hour, and the
51.33 average was 123% more
than Durban’s. Not that you
should think that things must
be better in 2010 – the crane
moves per hour in Durban
actually fell to 22.
Things have improved in
2010 in the average vessel
turnaround time. In 2008,
your container ship took 72
hours on average in Durban.
It was followed by Los
Angeles at 61 hrs, but was
still almost twice the average
for the six ports chosen, and
five times the wait at the
best (Laem Chabang). But
in 2010, Durban had done
enough magic to bring down
its turnaround time to
45 hrs average. This placed
it well ahead of the LA time
in 2008 – although the other
port figures are not yet
available for 2010.
How much does it cost
per ton to handle cargo?
According to TNPA figures,
the SA port network moved
12 602-tonnes for each R1-m
in assets in 2005. In 2010 –
when the total asset value had
moved up by over 165% – it
moved 5 453-t/R1-m.
In 2008 the TNPA
operating expenses (rands)
per tonne of output were
R6.30. In 2010 they were
R7.69/t.
It’s all there – and well
worth a read.
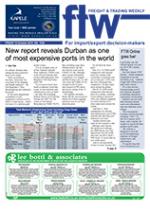
New report reveals Durban as one of most expensive ports in the world
15 Oct 2010 - by Alan Peat
0 Comments
FTW - 15 Oct 10

15 Oct 2010
15 Oct 2010
15 Oct 2010
15 Oct 2010
15 Oct 2010
15 Oct 2010
15 Oct 2010
15 Oct 2010
15 Oct 2010
Border Beat
17 Jun 2025
30 May 2025
Poll
Featured Jobs
New
