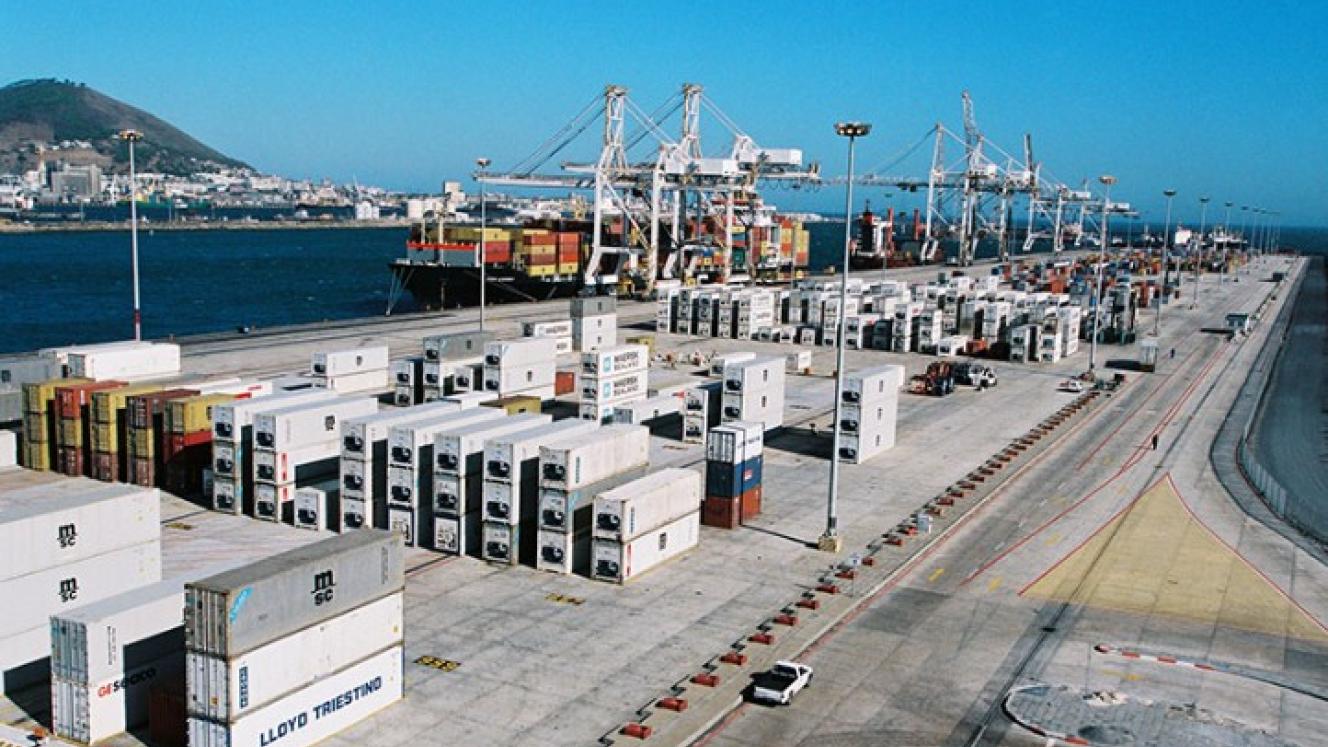
Cape Town’s cargo figures for the last measured period of the Container Port Performance Index (CPPI) shows a significant improvement of 237.9 points to a current score of -280.7 – the best improvement among 20 ports.
Although the port still recorded a negative reading, its TEU-handling data for 2023/24 showed the strongest improvement of all 403 ports measured.
Coega (Ngqura) is fourth on the CPPI’s ‘Top 20 ports improvement’ for the period, having increased by 160.4 to a negative score of -283.5.
Vital for reefer cargo out of the Western Cape, Cape Town has moved from a previous “stone last” ranking of 405 to 400.
According to the index, compiled by the World Bank in conjunction with S&P Global Market Intelligence, both ports remain in the lower performance range but have demonstrated significant year-on-year gains.
“Cape Town and Ngqura were among the world’s most improved ports, although they still have progress to achieve to reach average or better global performance standards,” the Bank’s Open Knowledge Repository says.
Compiled using data prior to the commissioning of new anti-sway cranes at Cape Town Container Terminal, the Repository points out that the port’s “standing has improved significantly from being the worst-performing port to showing strong operational gains, although it still has progress to make to reach average or above-average performance levels”.
“Cape Town is on a recovery trajectory but remains challenged by inefficiencies and delays compared to many other global ports.”
Disparaged in the past for using metrics that lack port-specific context, the South African Association of Freight Forwarders (Saaff) has acknowledged the findings of the latest index.
However, it has also stated that it was essential to put the CPPI in context.
Saaff said the index should be taken seriously for what it measured, keeping in mind what it doesn’t.
“The CPPI is an indicative, time-based index of container port performance that measures vessel time in port (arrival/waiting plus berth hours), normalised for ship and call size, using AIS/port-call data and a combined administrative/statistical method.
“By design, it does not capture landside/logistics performance (e.g. hinterland connectivity, customs, trucking/rail), costs, service quality, pricing, sustainability, or terminal-level variation, an indicative ranking, not a definitive, comprehensive measure of overall port performance.”
Saaff, which aggregates its own comprehensive freight data alongside Business Unity SA, compiled into a weekly Cargo Movement Update (CMU), said it “remains committed to working with Transnet, the National Roadmap for the Freight Logistics System, the broader national logistics stakeholder network, and the World Bank and partners to complement the CPPI”.
This is done by way of multidimensional indicators to contextualise scores with evidence on terminal handling performance, dwell times, gate/rail performance, service reliability, and terminal-level differences.
Saaff said the intention behind the CMUs was to show how decisions around logistics reflected the whole port system, not only waterside metrics.