Shipping companies,
hauliers and
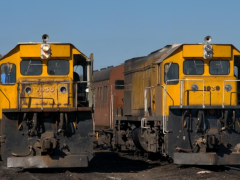
Transnet Freight
Rail are faced with
a continued challenge to
balance loads in and out of
the Eastern Cape, which
consistently has a negative
trade balance.
According to a 2015
report on trade and port
movements in the province
by the Eastern Cape Socio
Economic Consultative
Council (ECSECC), there
was a consistent deficit
between 2004 and 2014,
with the exception of 2008,
where the province recorded
a trade surplus of R1.6
billion.
Eastern Cape ports
handle around 16% of the
vessels calling on South
Africa, but a fraction of the
cargo – just 3.9% of the 61.8
m tons of freight handled
by the country’s ports in the
first quarter of 2015.
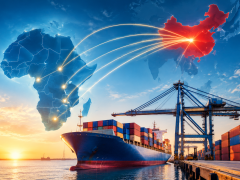
On the positive side
forwarders and shipping
companies with links to
Africa will have experienced
the biggest growth.
Exports to Africa more
than doubled from R2 105m
in 2013 to R5435m in 2014
– overtaking exports to the
Americas which stood at
R4 684m.
The Eastern Cape has
a positive trade balance
with Africa as imports
from the continent were
valued at R2 280m in 2014
– 5.7 times larger than the
R395m of 2013.
The value of exports
during the period rose
from R8.57bn in 2004
to R40.81bn in 2014,
while imports rose from
R23.34bn to R49.53bn over
the 10 years.
Put in a national
perspective, the Eastern
Cape has the fourth-largest
trade f low at
R90bn in 2014.
Gauteng’s
trade f low
was R1 287bn,
followed by the
Western Cape
(R346bn) and
KwaZulu-Natal
(R224bn) –
which is nearly
two and a half
times that of
the Eastern
Cape.
The
dependence
of the province on the
motor industry is ref lected
in the import and export
figures – Germany (home to
Volkswagen and Mercedes
Benz) is by far the biggest
trade partner – accounting
for 32.9% of exports and
44.8% of imports in 2014.
Thailand – which is one of
the world’s top exporters of
vehicles and components –
has the second-largest share
of imports to the Eastern
Cape (11.1%), followed by
China (8.9%).
The United States (12.7%
and China (12.4%) are the
second and third-largest
export destinations.
Namibia, with a 6.1%
share, is sixth.
The top export products
from the Eastern Cape
in 2014 were vehicles,
aircraft & vessels (R14.2bn),
followed by machinery
(R10.7bn) and textiles
(R4.1bn).
Among the top 10
exports plastics and rubber
was the fastest-growing
sector at 65.3%, followed
by chemicals with 64.2%
growth.
Strengthening the case
for a greater focus on agroindustry,
vegetable exports
grew by 53.8% between
2013 and 2014 to R2.1 bn.
The top import products
to the Eastern Cape in 2014
were vehicles aircraft &
vessels (R14.5bn), followed
by equipment components
(R11.2bn) and machinery
(R6.3bn).
Europe was the leading
export destination, with
exports estimated to be R16
865 m in 2014. The second
largest export destination
was Asia at R12 576 m.
Europe is the biggest
exporter to the Eastern
Cape at R27 383 m in
2014, followed by Asia
(R14 240 m) and the
Americas (R5 146 m).
![]()
![]()