The global liner shipping industry has undergone a dramatic transformation over the past five years, with significant changes in fleet size and ownership strategies among the world’s largest carriers, says ocean freight analyst, Lars Jensen.
These shifts are often overlooked amid day-to-day operations, adds the founder and CEO of Vespucci Maritime.
But it also signals a substantial realignment in competitive positioning and the fluctuating balance between owned and chartered capacity.
Using Alphaliner data, Jensen says the 12 largest global carriers have collectively grown their fleets by 44% since January 2020, with the share of vessels owned rising from 43% to 60%.
This period has seen some carriers expand their fleets at an unprecedented rate, while others have focused on integrating logistics services or maintaining a steady approach.
Jensen states the following:
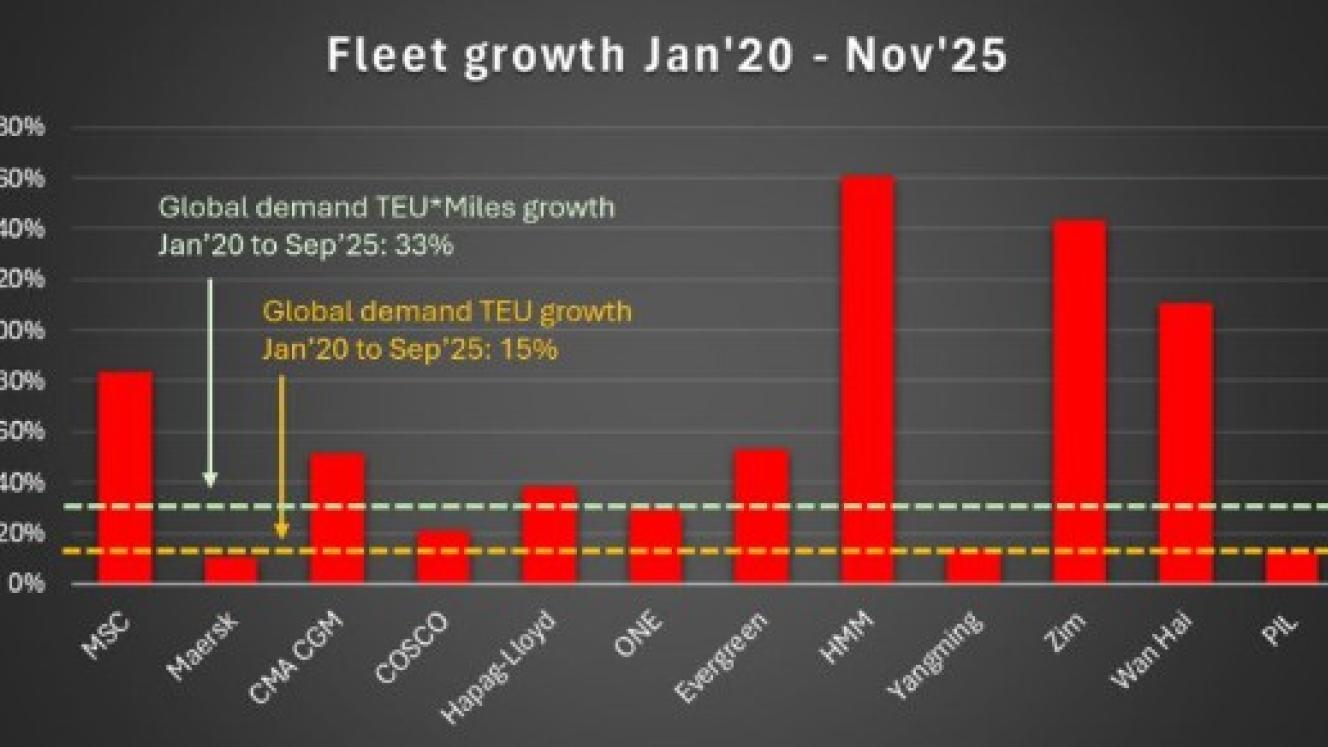
- MSC: Fleet growth of 83%, with the share of owned vessels increasing from 27% to 61%.
- Maersk: Fleet growth of 10%, with owned vessels rising from 56% to 60%.
- CMA CGM: Fleet growth of 51%, with owned vessels increasing from 37% to 61%.
- COSCO: Fleet growth of 21%, with owned vessels rising from 53% to 60%.
- Hapag-Lloyd: Fleet growth of 38%, with the share of owned vessels unchanged at 60%.
- ONE: Fleet growth of 29%, with owned vessels increasing from 34% to 45%.
- Evergreen: Fleet growth of 53%, with owned vessels rising from 44% to 69%.
- Yangming: Fleet growth of 13%, with owned vessels increasing from 30% to 46%.
- HMM: Fleet growth of 161%, with owned vessels rising from 35% to 81%.
- Zim: Fleet growth of 143%, with owned vessels increasing from 2% to 12%.
- Wan Hai: Fleet growth of 111%, with owned vessels rising from 60% to 99%.
- PIL: Fleet growth of 12%, with owned vessels increasing from 40% to 71%.
Global demand measured in TEU has grown by 15% from January 2020 to September 2025, he says, while demand measured in TEU miles has increased by 33%, largely due to the Red Sea crisis diverting cargo around Africa.
Jensen furthermore points out that the latest shipping market report from Danish Ship Finance highlights that Chinese shipyards now have an average orderbook cover of 3.7 years, compared with 2.5 years in South Korea and 1.4 years in Japan. These yards collectively hold 88% of global shipbuilding capacity.
This trend is significant in light of the paused USTR (Trade Representative) fees and American political ambitions to shift orders away from China. The high orderbook cover in China means that future vessel orders are likely to move away from Chinese yards, not necessarily due to political pressure, but because of the physical reality of yard availability.
The surge in fleet growth and the shift towards greater ownership reflect a strategic response to market volatility and changing global trade patterns, Jensen points out.
As carriers continue to invest in newbuilds and adjust their fleets, the competitive landscape of the liner shipping industry is set to evolve further in the coming years.