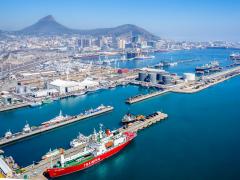
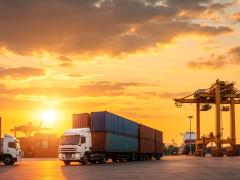
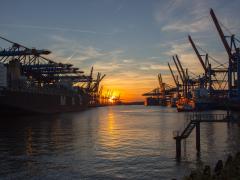
As we pass the half-year mark, it is appropriate to interrogate volume stats as supplied by Transnet National Ports Authority (TNPA) for the Port of Durban, according to Dave Watts, maritime director of the SA Association of Freight Forwarders (Saaff). “As Durban is by some way the busiest port in sub- Saharan Arica and handles a comprehensive range of products using every mode of ocean transport,” he told FTW, “the port’s activity has a very direct relationship to SA’s economic progress and to that of the region.” Container volume growth can be an important indicator of both trade levels and economic activity. But, Watts warned, there needs to be careful analysis of the figures before any clear conclusions can be drawn. The increase in full export TEUs of 6.88% – 328 390 to June 2013 versus 307 242 in 2012 – is a case in point, he added. “There is really no way of knowing if such an improvement is driven by increased trade. Or whether it’s a result of exporters converting previously non-containerised freight to containers because of the R1-billion rebate applied by TNPA in financial 2012/13 – and the substantial reduction in cargo dues in the current financial year.” Just one example of this shift, according to Watts, is that perishable product exporters, particularly citrus, have reported that shippers have been moving away from breakbulk to containerised during the current season. “What is of real concern for both those involved in the ocean supply chain and the economy as a whole is the slow level of export recovery from the 2008 global financial maelstrom,” he said. In the six months to June 2008, Durban handled 446 069 full export TEUs, a rather significant 36% more than the same period this year. But imports have fared slightly better making the same comparison. In 2008 524 867 full TEUs were landed. This year (with a 4.86% increase over 2012) the figure is 511 855 – a drop of 2.5% over the half-year period five years ago. The TNPA’s figures, drawn from cargo dues orders, throw light on other areas of port activity. “There has been a substantial 40.23% drop in transhipped, full TEUs year-on-year in Durban, largely as a result of this traffic diverting to the Cape ports and elsewhere,” said Watts. “Also, the imbalance between 12 metre and 6m containers on the SA trade route continues to provide ship owners with sleepless nights. This as they battle to find space to export the oversupply of 12m containers, while not always having sufficient of the smaller boxes.” Looking at the figures for empty boxes shipped, Watts noted that there had been virtually no change from last year. A total of 213 062 empty TEUs were shipped out, the vast majority of which were 12m. “Once again, the possibility of nearly half a million empty TEUs moving out of Durban by year-end raises its head. In 2012 the 452 270 empties shipped deep-sea, compared with 622 382 full TEUs, represented over 42% of all export moves. “The impact of this huge disparity on SA’s ocean logistics costs has yet to be calculated." INSERT 1 36% How many more full export boxes were handled in first half 2008 compared to 2013. INSERT 2 40.23 The percentage drop in transhipped full TEUs in Durban. CAPTION More boxes ... but are they a sign of increased trade?
Empty numbers?
Comments | 0
© Now Media. This content is protected by copyright and may not be adapted or republished. If you would like to discuss cooperation opportunities, please contact: editor@freightnews.co.za.