Europe follows with half the volume, writes Alan Peat
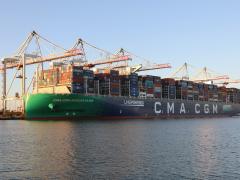
USING THE 2000 cargo volume figures from the Port of Durban as a barometer, Asia is in firm number one spot as a two-way trading partner of SA.
The 12.24-million tons of cargo gives the Orient more than 41% of the total sea cargo passing through Durban - with 5.8-mt in imports, and 6.4-mt in exports.
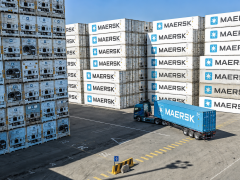
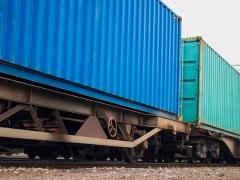
Of the import total, more than 4-mt were in containerised form, as were over 2.4-mt of the exports.
The next best performing world area was Europe, with 6.2-mt, which just shades above half that of the Asian trade. But, add the UK figure of over 2-mt of SA trade, and it becomes a closer contest.
In third spot is North America (US & Canada) - with a two-way trade total of just over 3.5-mt, and an 11.8% share of total sea trade through Durban.
But the point to note here is the significance of bulk and breakbulk cargoes in that total. Less than 585-mt of the 1.7-mt in imports from the US are containerised - and a similarly low figure of 470-mt of the 1.9-mt in exports travel by that mode.
In the imports:v:exports league one point to note is that - almost invariably - the SA export total is above the import figure. But this, pointed out Ronnie Holtshausen, marketing manager at Portnet in Durban, can be explained by the fact that the statistics are in tons - and the port exports almost 10-mt of bulk-breakbulk cargo, compared to just under 6.5-mt in containers.
The containerised figures tell a different version of the same story. More than half (7.95-mt) of the 13.4-mt total of imports travelled in boxes. However, less than 40% (that 6.5-mt) of the 16.4-mt of exports travelled in that mode.
The boxes tend to be the high value cargoes, according to Holtshausen. And the significant totals for containerised imports from Asia and Europe/UK - compared to a much lower proportion of containerised export trade - probably paint a better overall trade picture from the statistics.
The same can be said of the SA-Africa imbalance - but this time heavily in favour of SA exports. Of the 494.7-mt in imports - some 70% is lower-value non-containerised goods. But, of the 2.2-mt in exports to the continent through Durban harbour, 1.2-mt (almost 55%) is containerised.
A tonnage imbalance - made even more so when converted into monetary terms
Copyright Now Media (Pty) Ltd
No article may be reproduced without the written permission of the editor
To respond to this article send your email to joyo@nowmedia.co.za